Plotting
Plot Nodes
Plots have a somewhat special role in the node system:
We need a node to make plots aware of incoming data, but the node will (typically) not do anything to the data.
In the simplest case, Node.process will just call a function that triggers plotting, using the just received data.
For many applications the base class PlotNode will do the job without any need to customize.
Plot Widgets
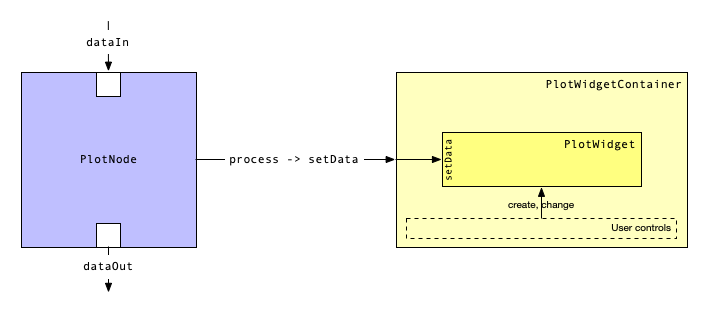
To make the plot node aware of the presence of a GUI, a suitable widget must be connected to it.
This can be done by instantiating PlotWidgetContainer, and passing the instance to the node’s setPlotWidgetContainer method.
This will make sure that the container’s setData is called whenever the node receives data.
The container can then in turn host a PlotWidgetContainer, which is connected by using setPlotWidget.
The reason why we don’t connect the widget directly to the node is that the container may provide controls to change the widgets through user controls.
See the API documentation for more details.
Automatic plotting with Matplotlib
The most commonly used plot widget is based on matplotlib: AutoPlot.
It determines automatically what an appropriate visualization of the received data is, and then plots that (at least if it can determine a good way to plot).
At the same time it gives the user a little bit of control over the appearance (partially through native matplotlib tools).
To separate plotting from the GUI elements we use FigureMaker.
See the API documentation for more details.